How I turned a backyard weather station into a full-stack data project — with Python collectors, interval partitioning, and a dark-themed dashboard that makes me actually want to check the weather.
The Problem With Cloud-Only Weather Data
I love my WeatherFlow Tempest weather station. It’s a beautifully engineered piece of hardware — no moving parts, solar-powered, and it broadcasts observations every minute via both UDP on the local network and to WeatherFlow’s cloud API.
But here’s the thing: I’m an Oracle person. I wanted my weather data in my database, on my terms. I wanted to write SQL against years of minute-by-minute observations. I wanted to build dashboards that looked exactly how I wanted them to look. And frankly, I wanted a project.
So I built one.
The Architecture: Two Collectors, One Database
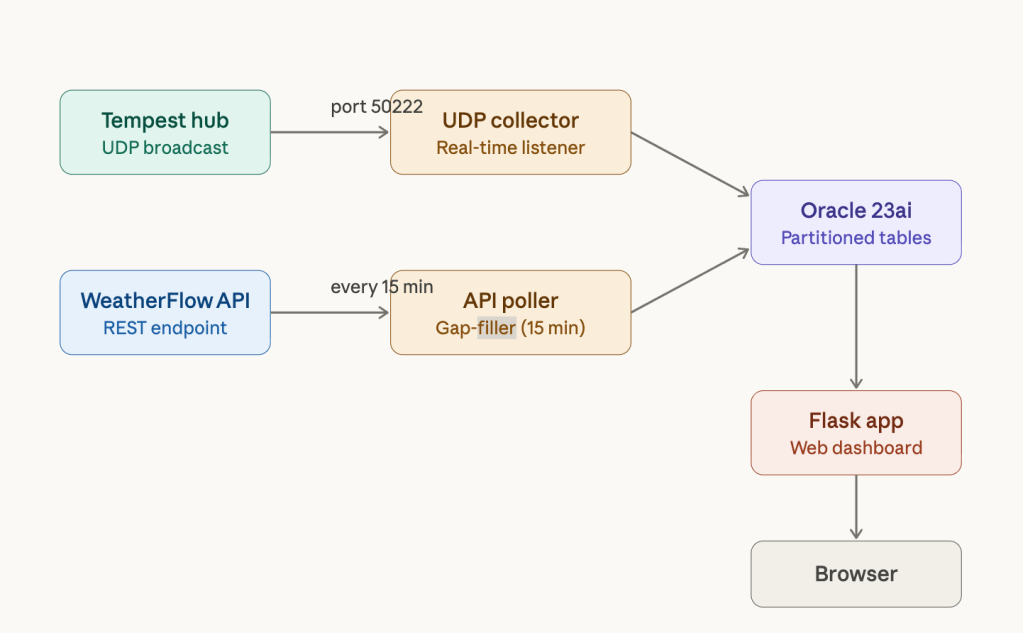
The system has three main components:
- UDP Collector — A Python script that listens for real-time broadcasts from the Tempest hub on port 50222
- API Poller — A companion script that calls the WeatherFlow REST API every 15 minutes to fill gaps and grab data the UDP packets don’t include (like
feels_liketemperature) - Oracle 23ai Free — Running in Docker, storing everything in interval-partitioned tables
Why Two Collectors?
The UDP broadcasts are great for real-time data — you get observations within seconds of the sensor reading them. But they have limitations:
- If your collector is down, you miss data
- Some calculated fields (heat index, dew point) aren’t in the UDP packet
- Network hiccups mean lost packets with no retry
The API poller solves all of this. It runs every 15 minutes, fetches the last 20 minutes of data, and uses an Oracle MERGEstatement to upsert only the missing records. The UDP collector inserts with source 'UDP'; the API poller inserts with source 'API'. If a record already exists from UDP, the merge preserves it.
The Database Schema: Interval Partitioning Is Magic
This is where it gets fun. Oracle’s interval partitioning automatically creates a new partition for each day of data:
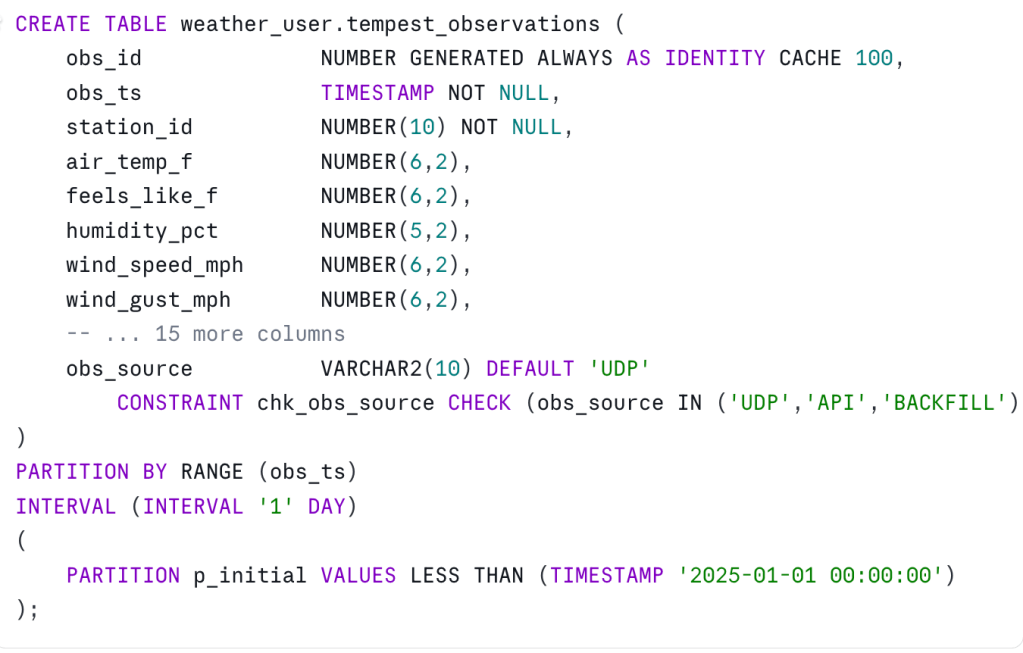
With this setup:
- I never have to create partitions manually — Oracle does it as data arrives
- Queries against a specific date range only touch the relevant partitions
- I can easily drop old data by dropping partitions
- Backfills from the API get their own partitions automatically
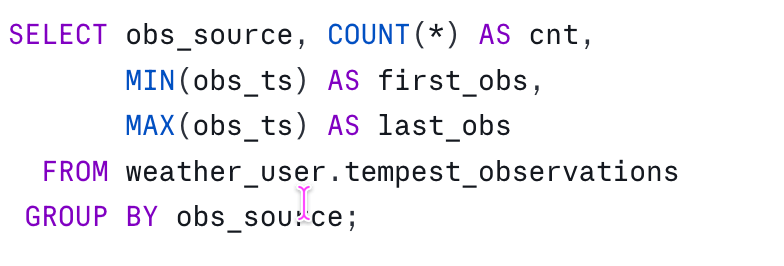
The obs_source column tracks where each reading came from. Running a quick aggregate shows the split:
The Collectors: Python Doing What Python Does Best
UDP Collector
The UDP collector is a tight loop: bind to port 50222, parse JSON packets, insert into Oracle. The Tempest hub sends several message types, but we only care about obs_st (station observations):
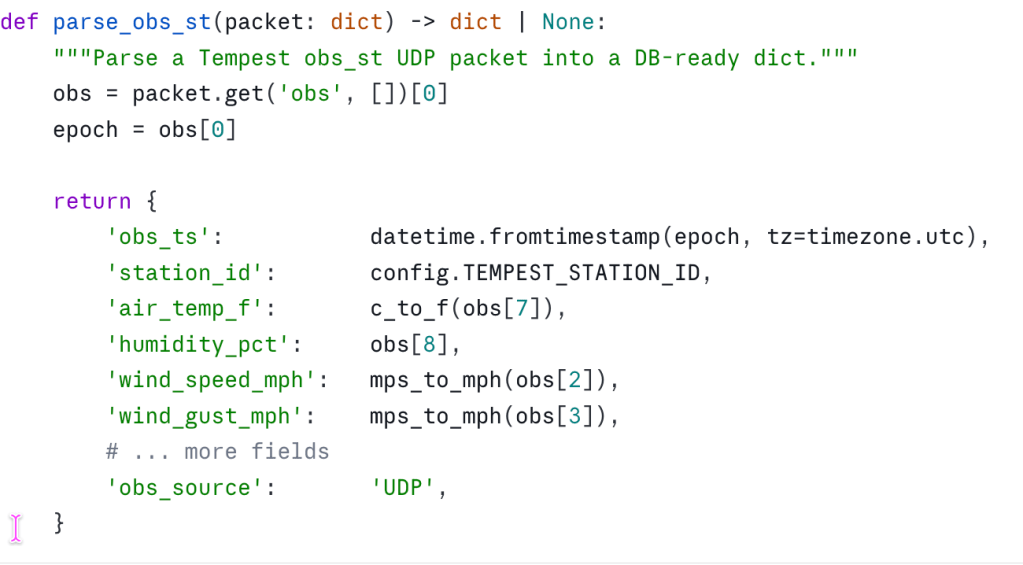
The WeatherFlow UDP protocol uses positional arrays — obs[7] is air temperature in Celsius, obs[8] is humidity, and so on. Not the prettiest API, but fast and compact.
API Poller
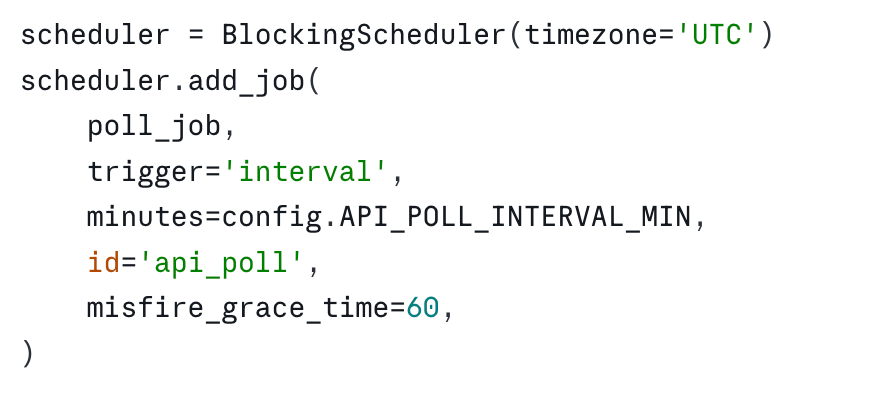
The API poller uses APScheduler to run every 15 minutes:
The actual polling fetches a time window and upserts using a MERGE statement:
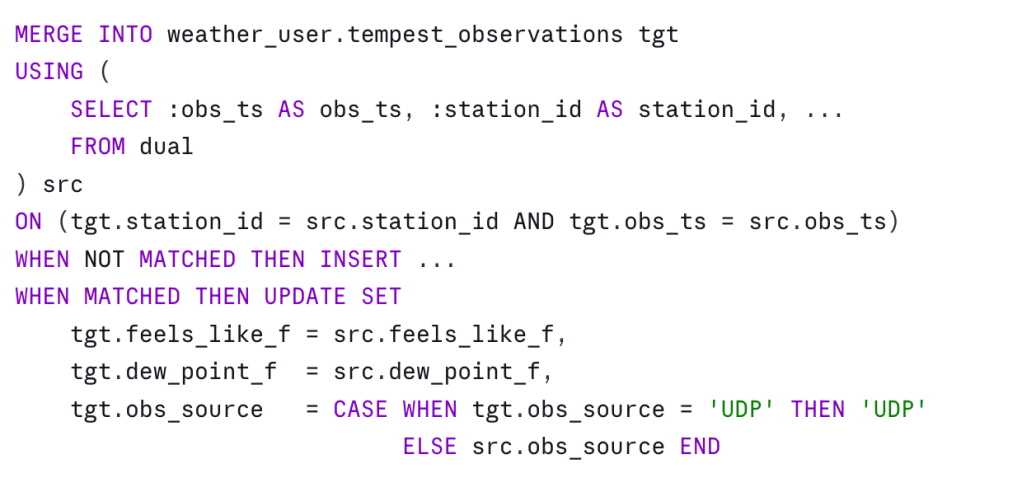
That CASE statement is important: if a record exists from UDP, we keep the source as 'UDP' even when the API also returns it. UDP gets credit for being first.
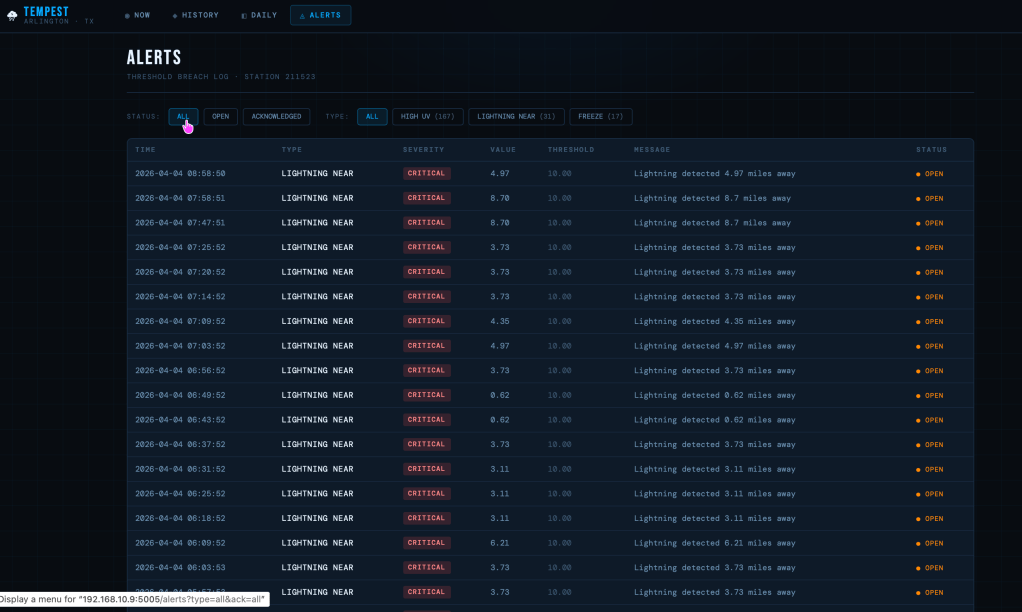
Alerts: When The Weather Gets Interesting
Texas weather is dramatic. I wanted to know immediately when:
- Wind gusts exceed 35 mph
- Lightning is detected within 10 miles
- Temperature drops to freezing
- Heat index hits 105°F
- UV index reaches dangerous levels
The UDP collector evaluates thresholds on every observation:
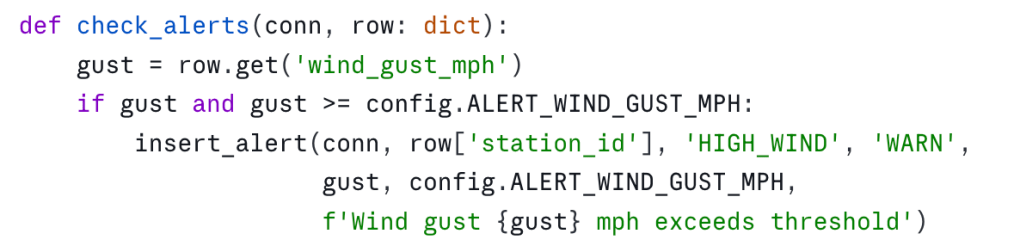
A cooldown timer prevents alert floods — the same alert type won’t fire more than once every 5 minutes.
The Dashboard: Dark Theme, Real Data
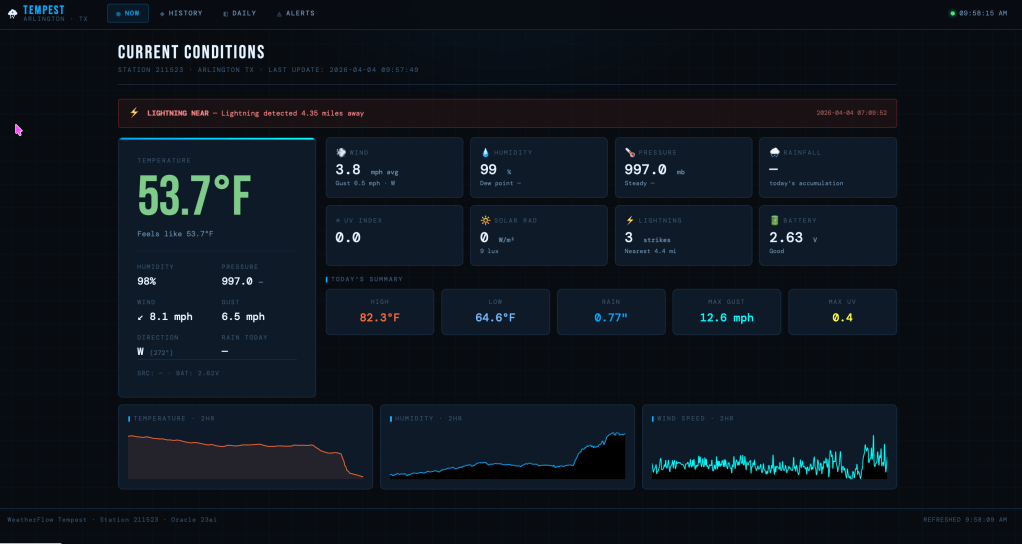
The Flask web app pulls from the database and renders a dark, industrial-looking dashboard. I went for a design that feels like a weather monitoring station, not a mobile app.
Current Conditions
The main page shows a hero temperature card with feels-like, humidity, and wind in a supporting grid. Key design choices:
- Temperature color-coded by range — hot (95°F+) renders orange-red, freezing renders blue
- Wind direction as an arrow glyph — rotated to match the bearing
- UV index with a gradient bar — visual indication of where you are on the danger scale
- 2-hour sparklines — see trends at a glance
Auto-refresh polls /api/refresh every 30 seconds without a full page reload.
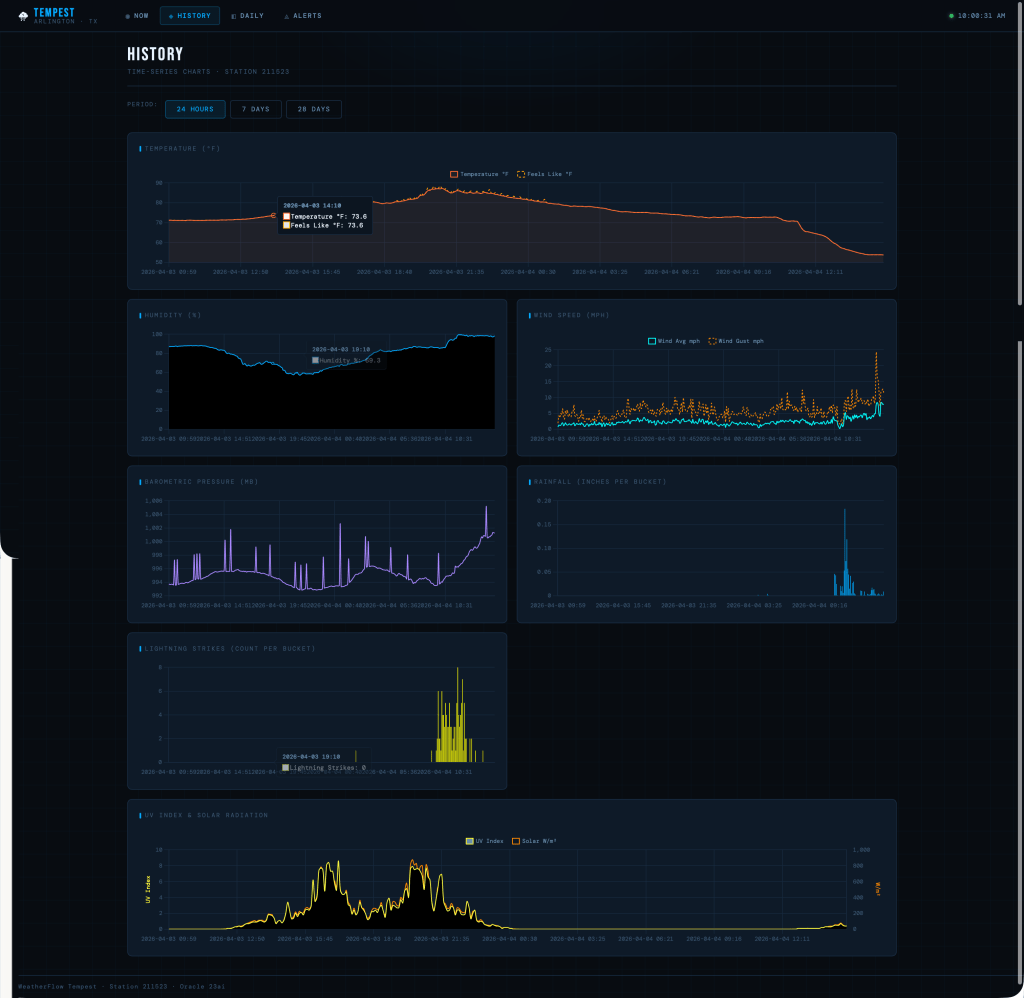
History Charts
The history page renders interactive Chart.js graphs for the last 24 hours, 7 days, or 28 days:
- Temperature (with feels-like overlay)
- Humidity
- Wind speed and gusts
- Barometric pressure
- Rainfall (bar chart)
- Lightning strikes (bar chart)
- UV index + solar radiation (dual Y-axis)
The backend buckets the data appropriately — minute-level for 24h, hourly for 7d, 4-hour buckets for 28d.
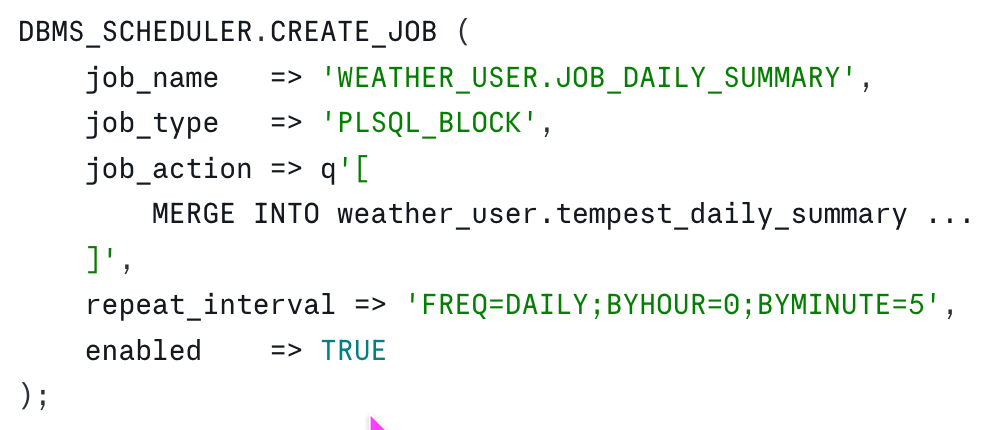
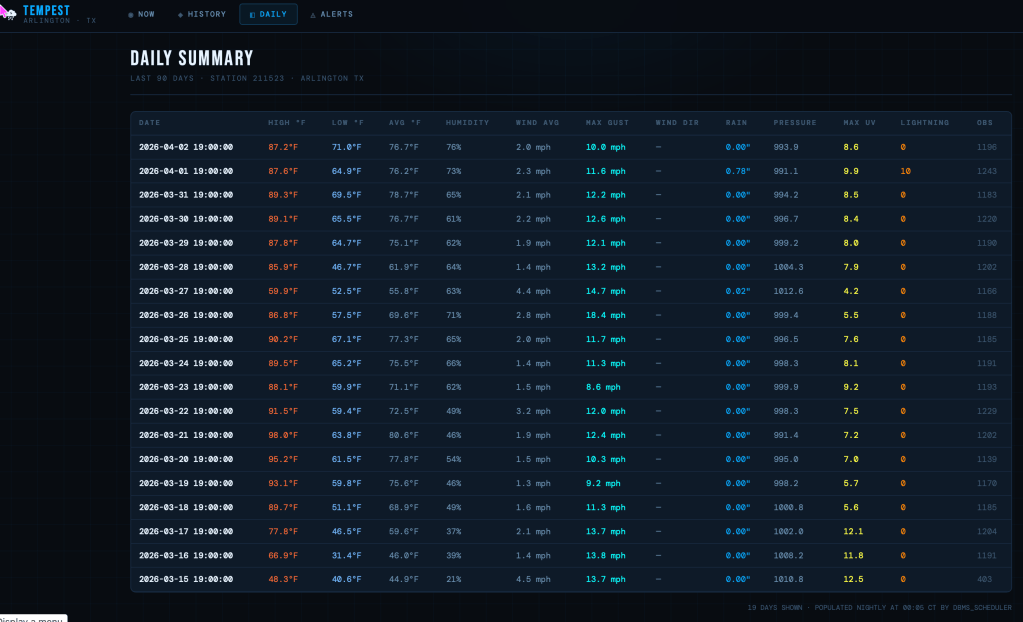
Daily Summary
A classic data table showing high/low/average temperatures, total rainfall, max wind gusts, and observation counts for each day. This data comes from the tempest_daily_summary table, populated nightly by a DBMS_SCHEDULER job:
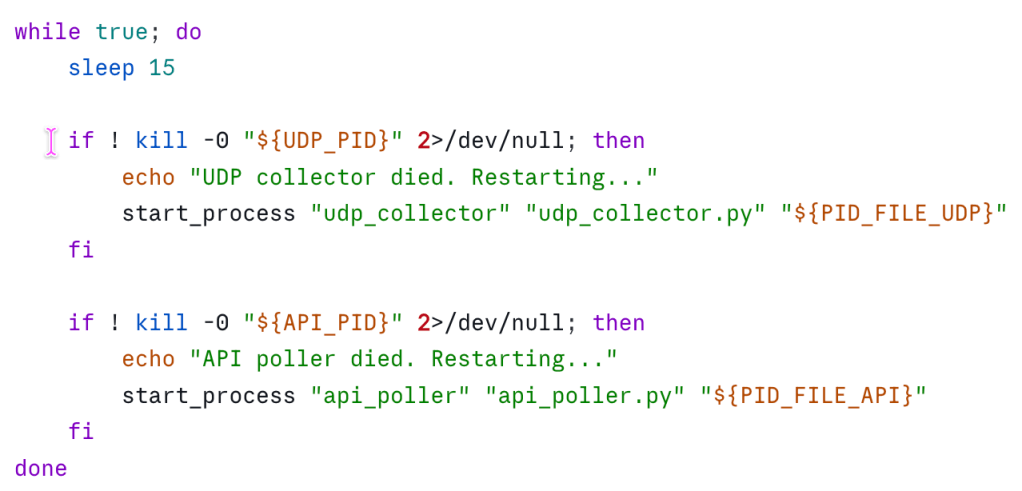
Running It All: A Bash Wrapper With Auto-Restart
Both collectors run from a single launcher script that monitors their PIDs and restarts them if they crash:
On macOS, a launchd plist starts this at login and keeps it running. The collectors write to /var/log/tempest/ with rotating logs.
What I Learned
Oracle’s Connection Pooling Is Worth The Setup
Using oracledb.create_pool() instead of individual connections made a huge difference. The UDP collector processes 1,440 observations per day — that’s a lot of connection overhead if you’re not pooling.
Unit Conversion Is The Boring Part (But Get It Right)
The Tempest sends everything in metric: Celsius, m/s, millibars, mm. Converting to imperial units for display is straightforward, but you have to be consistent about when you convert. I do it at ingestion time — everything in the database is already in °F, mph, and inches.
Interval Partitioning Changes How You Think About Data
Once you have automatic daily partitions, you start thinking in terms of “drop everything older than 2 years” instead of massive DELETE statements. Partition maintenance becomes trivial.
Dark Themes Are Harder Than They Look
Getting contrast right in dark mode took more iteration than I expected. The CSS uses a lot of CSS variables (--text-primary, --text-secondary, --text-muted) to maintain hierarchy without blowing out bright whites against dark backgrounds.
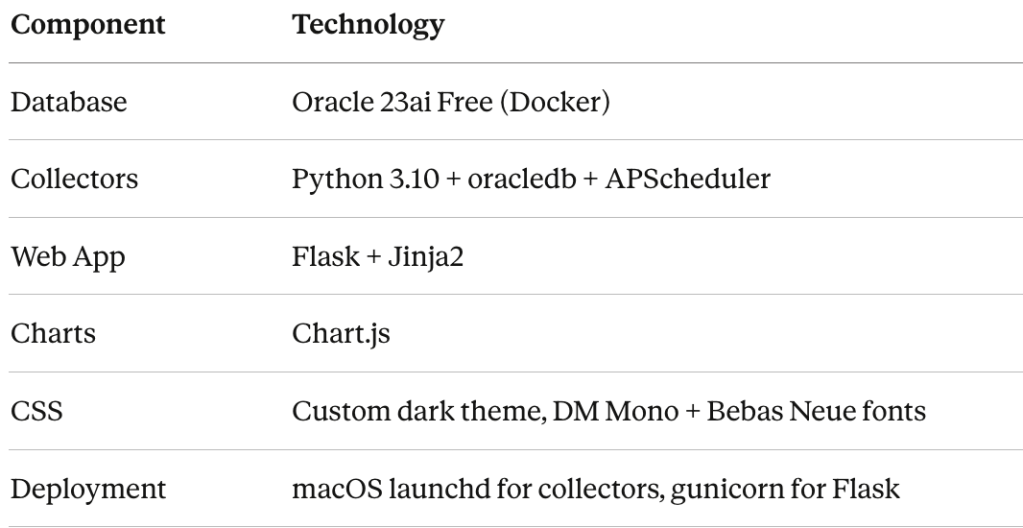
The Stack
What’s Next
A few ideas on the roadmap:
- Grafana dashboards for more sophisticated visualization
- Historical comparisons — “how does this April compare to last April?”
- Machine learning experiments — can I predict tomorrow’s high from the last 7 days?
- Mobile PWA — the current site is responsive, but a proper app would be nice
For now, I’m happy. I’ve got my data in Oracle where I can query it however I want. I’ve got a dashboard that loads instantly because it’s running on my local network. And every time I check the temperature, I feel that small satisfaction of knowing the whole stack, from sensor to screen.
The Tempest weather station is available from WeatherFlow. The Oracle 23ai Free Docker image is… free. The Python code is straightforward enough that even self-proclaimed “crap at coding” Oracle people can build it.

Leave a comment